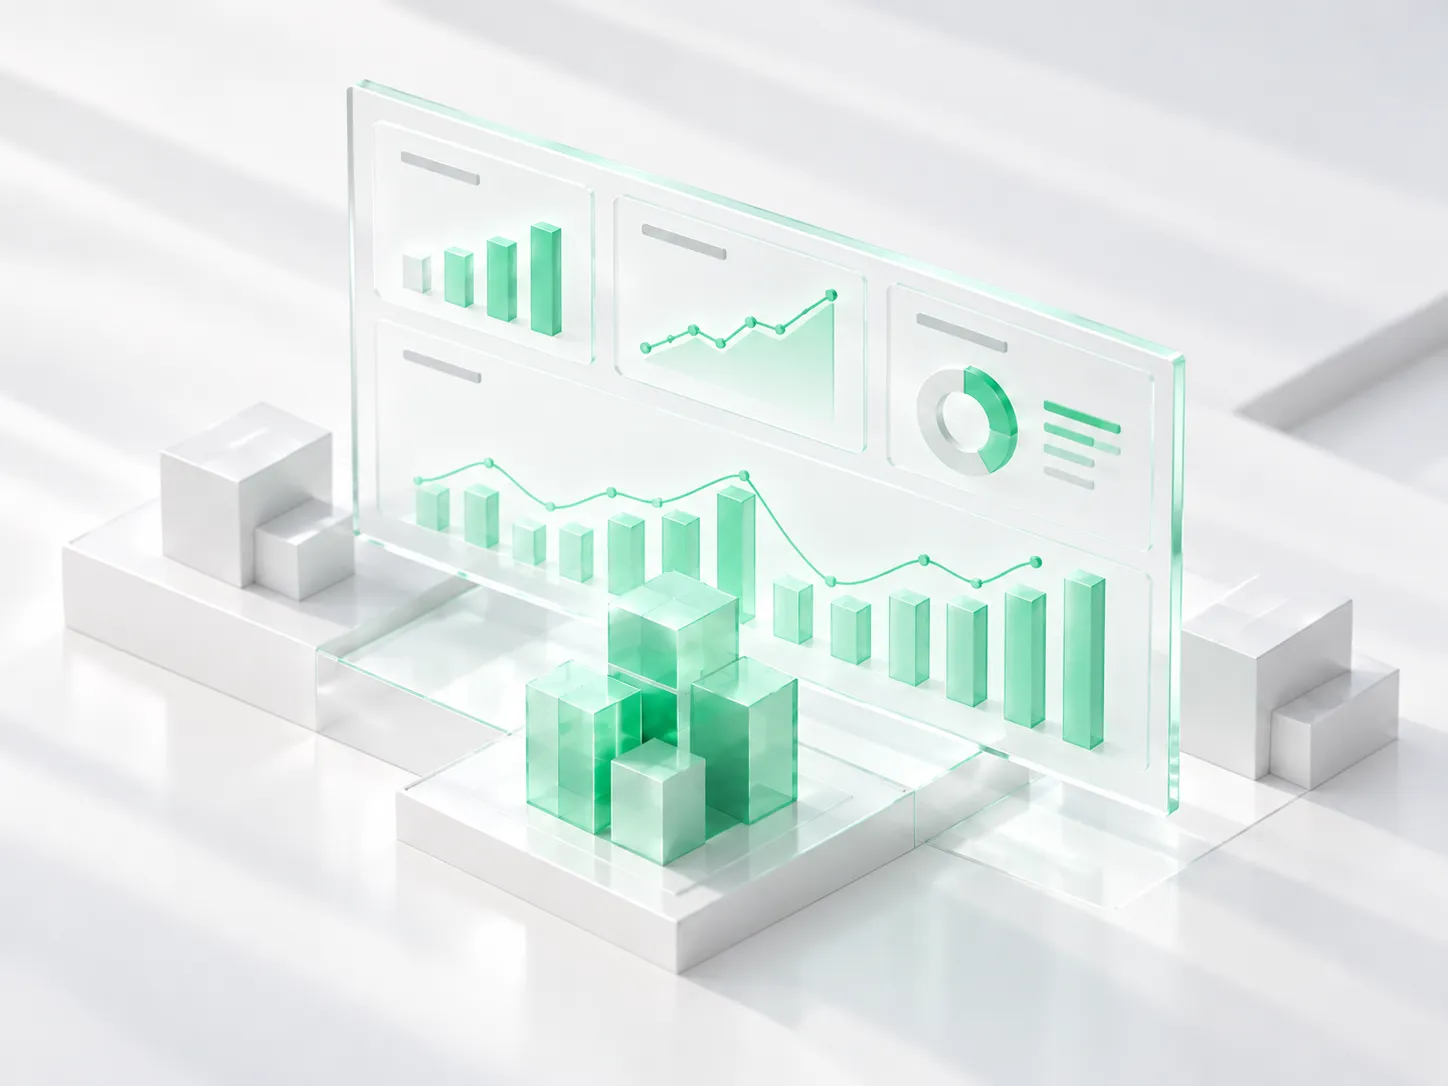
See the portfolio before the board pack.

Corvenia connects financial data across every portfolio company into one trusted view. See what is changing, understand why and focus attention where it can create value.

Try now – 14 days free
arrow-right icon
The portfolio visibility problem

As portfolios grow, understanding what is happening across them gets harder. Every acquisition brings another ERP, chart of accounts and way of reporting. By the time the numbers are consolidated, what you are looking at may already be weeks old.

time
4–6 weeks behind
By the time portfolio financials reach you, the problems behind the numbers may already have changed.
system
Different systems, different structures
Every acquisition adds another ERP, chart of accounts and reporting structure.
report
Too much manual work
Finance teams and operating partners spend valuable time collecting, mapping and reconciling data instead of understanding what it means.
One portfolio. One trusted view.

Corvenia connects financial data across your portfolio and continuously consolidates it into one trusted view – without replacing the systems your companies already use. From portfolio level to individual transactions, you can see what is changing, understand why and know where to focus.

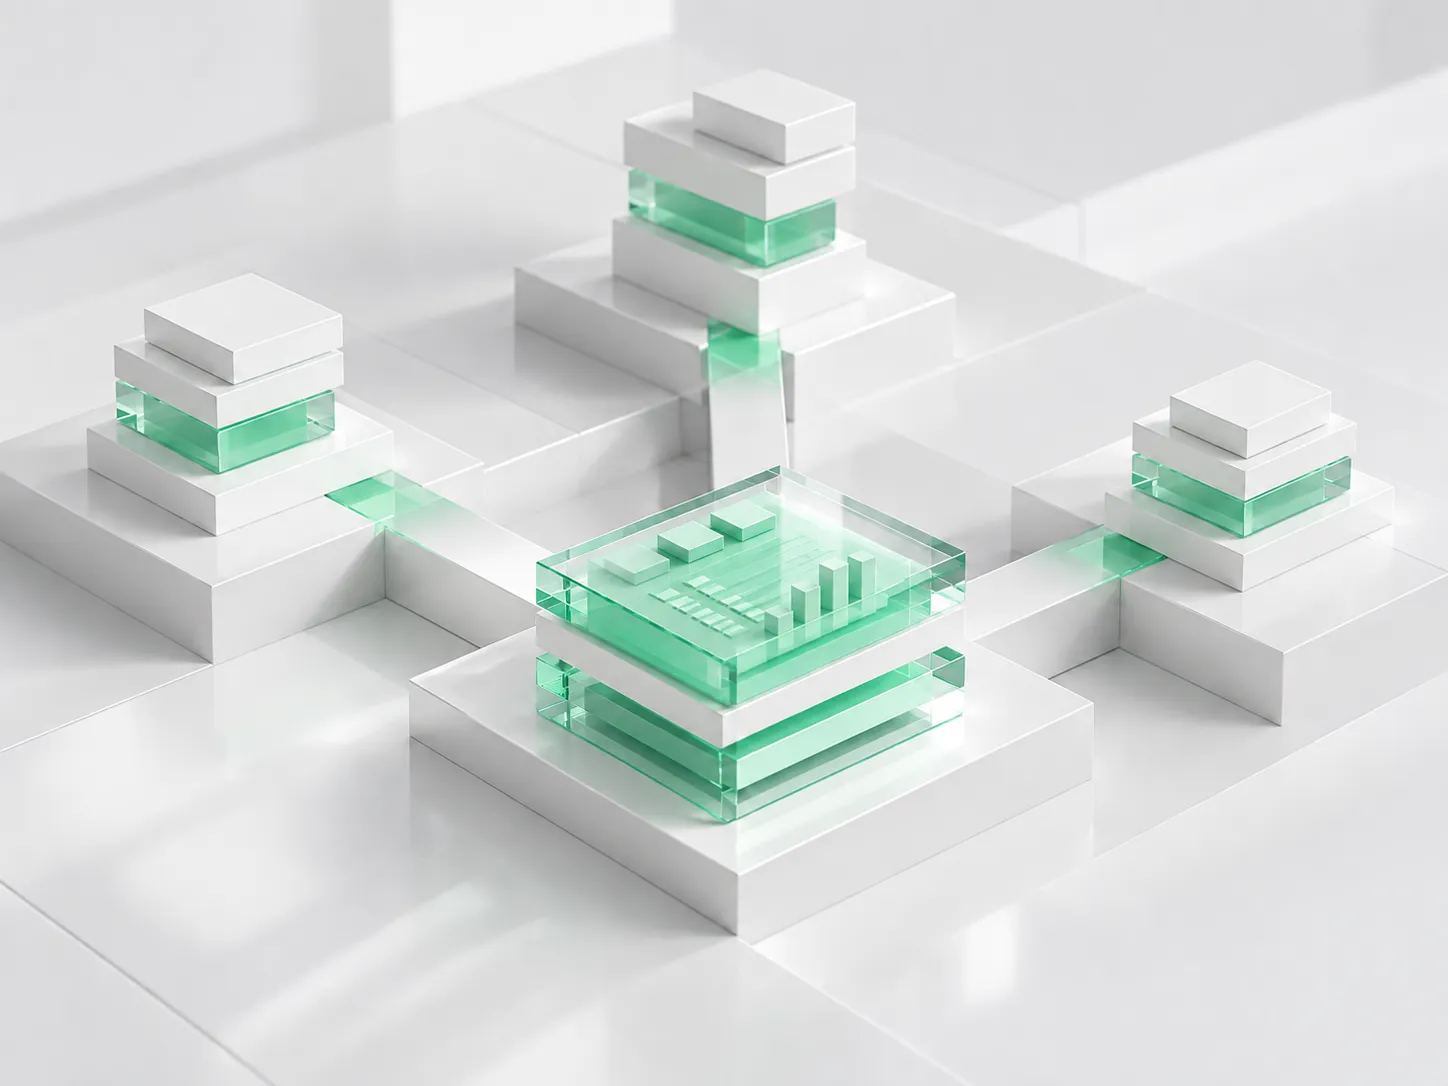
How Corvenia solves this
See what is happening.
Connect financial data across portfolio companies, regardless of ERP, structure or chart of accounts. Corvenia continuously collects and consolidates the data, giving you an up-to-date view across the portfolio.
Connect existing ERP systems
AI-powered account mapping
Continuous data ingestion
Automated intercompany eliminations
Isometric illustration of two interconnected gray 3D blocks above a message bar stating all accounts are mapped successfully, with Review and Approve buttons.
3D isometric illustration of a server tower with a cube on top, next to a finance performance chart with a checkmark.
Understand why.
Corvenia analyses changes and anomalies across the portfolio and lets you trace them all the way back to the underlying transactions.
KPI monitoring
Anomaly detection
Early warnings
Transaction-level traceability
Know where to act.
Compare performance across companies, identify what drives the differences and focus attention where it can create the most value.
Portfolio company comparison
Performance analysis
Operational and financial data
Root-cause analysis
3D laptop displaying bar and line charts with additional floating icons and a 16.4% year-over-year EBIDTA increase indicator.
3D illustration of interconnected white and translucent green square blocks on a white stepped surface, with one block featuring a translucent padlock symbol, representing data security or blockchain network.
Built for complex portfolios
speed
Connect new acquisitions in days
Bring new companies into the portfolio view without lengthy integration projects or replacing their existing systems.
view icon
See change as it happens
Continuous data gives you a current view of the portfolio – not just a snapshot of what happened weeks ago.
tool
Keep the tools your teams already use
Continue working in Excel and Power BI while Corvenia connects and structures the underlying data.
built
Built for portfolio complexity
Different companies. Different systems. Different structures. Corvenia creates one trusted view across them.
Trusted by
Case study
arrow-right icon

Vemund Helgesen
Group Controller at Qben Infra

quote

Intercompany eliminations and reconciliations consume a disproportionate amount of time. Matching positions, chasing down discrepancies, coordinating across multiple levels in the group – that's a lot of time, from a lot of people. Corvenia’s automated IC matching removes much of that back-and-forth, and for a group our size, that's a massive win.

Qben logo with an orange hexagonal shape and dark gray text.
Nasdaq-listed infrastructure platform
Corvenia
Understand the whole portfolio. As it changes.
See how Corvenia connects your portfolio data into one trusted view, without replacing the systems already in place.